In September 2000, leaders from across the world gathered at the United Nations for the Millennium Summit, and adopted the Millennium Declaration, which committed humanity to achieving the Millennium Development Goals (MDGs) by 2015.
The MDGs consist of eight goals, on reducing poverty and other related aspirations, such as achieving universal primary education (i.e. ensuring that every child, regardless of sex, goes to primary school and completes primary education).
This effort brought about concerted efforts by governments, the development community, and various stakeholders to meet the MDGs, and to accelerate progress in meeting them. Examinations by the development community, such as the Asian Development Bank’s Independent Evaluation Department, and the United Nations Children’s Fund, have indicated considerable progress particularly on education-MDGs, although progress has been very uneven not only across countries, but within countries.
Globally, an estimated 25 million children, 15 million girls and 10 millions boys, are likely never to go to school. In addition, older children appear to be more likely to be out-of-school than their younger counterparts. Further, a bigger share of primary- and secondary-aged children from poor families do not go to school compared to children from the higher income distribution.
Children residing in rural areas are also far more likely to be out of school (and even engaged in economic activities) than those from the urban areas. The disparities between rural folk and urban folk, as well as between the poor and non-poor, ultimately suggest that a primary reason for the lack of participation of children is economic.
Social programs
In the Philippines, the government decided to spend much more on social programs (than its predecessors), including increasing the budget of the Department of Education (DepED) to address input deficits, i.e., building more schools and classrooms, purchasing more chairs, hiring more teachers, among others, as well as providing resources to address demand-side issues.
For 2015 alone, the DepED budget in this case totals P361.7 billion, representing an increase of 18.6% from the previous year, which included a P53.9-billion allocation for Basic Education Facilities, sufficient to build 9,500 classrooms, repair over 31 thousand classrooms, develop over 13,000 water and sanitation facilities, and purchase 1.3 million chairs.
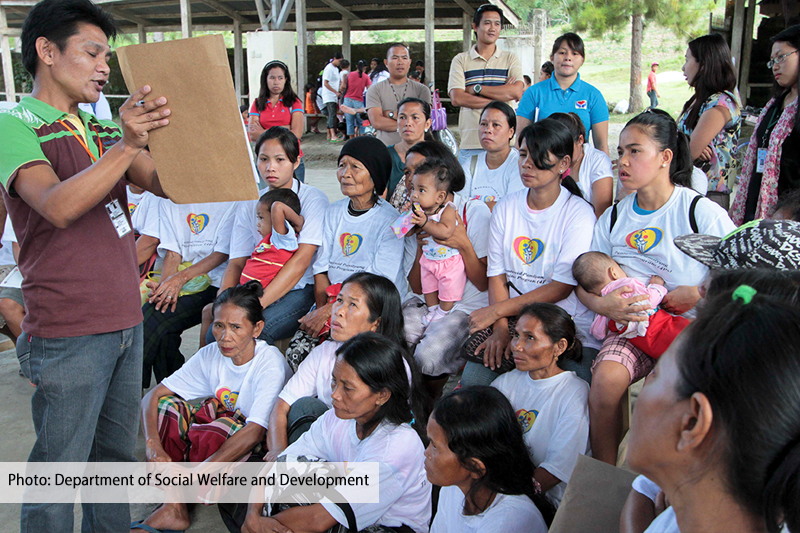
Government’s interventions on the demand side include a massive investment inPantawid Pamilya, the conditional cash transfer program implemented by the Department of Social Welfare and Development (DSWD), aside from more attention to feeding "severely wasted” children in schools and in day care centers.
The CCT Program has been extensively scrutinized, with the increased resources provided to Pantawid. Rightfully, every program involving public funds should undergo careful examination, but examinations must be fair.
It has been suggested that the CCT is ineffective since official poverty rates from the Family Income Expenditure Survey (FIES) of the Philippine Statistics Authority (PSA) have remain unchanged from 2006 to 2012 despite the huge cost for implementingPantawid.
In a previous article, we pointed out that the main purpose of the CCT is to increase school participation of children from poor families, and that poverty rates would not be expected to change considerably in the short term since the maximum cash support given to beneficiary households is far less than what they would require to cross the poverty line. Effects on income poverty would be expected when the children beneficiaries join the labor market with improved education attainments.
Education indicators
Both the first wave and second wave of impact evaluation studies by the World Bank as well as an analytical report at the Philippine Institute for Development Studies suggest that Pantawid Pamilya has resulted in improved school participation for beneficiary households, compared to households who are not beneficiaries ofPantawid.
In the following table, we show education indicators from 2007 to 2013 sourced from the Annual Poverty Indicator Survey (APIS), a yearly survey conducted by the Philippine Statistics Authority (PSA) on years when the PSA does not conduct the triennial FIES.
We see that while about 90% of children aged five to fifteen were in school from 2007 to 2010, the proportion of five-to-fifteen year old children that were in school has gone up to about 95 percent by 2013. In addition, while in 2007, there were an estimated 3.01 million out-of-school children (OOSC) between five to fifteen years old, the magnitude of OOSC has gone down to 1.2 million by 2013.
Table 1.
Selected Education Indicators on School Participation and Out-of-School Children among Children Aged Five to Fifteen years Old
Education Indicator 2013 2011 2010 2008 2007
School Participation Rates 94.79 92.00 89.58 90.73 89.97
Adjusted Net Attendance Rates 85.86 83.91 80.39 79.62 78.99
Number of Out of School Children (OOSC) in millions 1.20 2.01 2.60 2.33 3.01
Note: Authors’ calculations from APIS 2007, 2008 and 2010, 2011, and 2013 (conducted by PSA).
Whether we examine school participation rates, or adjusted net attendance rates (which refer to the ratio of the number of children in an age range that attends the proper education tier or higher relative to the number of children of the school-age range) from the APIS for the periods 2007 up to 2013, we find clear evidence that government’s investments in Pantawid and in higher budgets for DepED have paid off. These investments have contributed to remarkably improved participation of children in basic education.
The big improvements between 2010 and 2013 (see Figure 1) come after government through DepED officially started to make Kindergarten mandatory for incoming primary school students, and DSWD was provided more investments for the CCT to encourage children from poor families to send their children to school.
Figure 1. School Participation of Children Aged Five to Fifteeen Years old, 2010 and 2013
Note: Authors’ calculations from APIS 2007, 2008 and 2010, 2011, and 2013 (conducted by PSA).
Years ago, we pointed out in a PIDS policy note that in the Philippines, there are also gender disparities in school attendance, but with reversed trends from that of the world: girls are becoming more educated than boys.
Even recent data from APIS 2013 (as indicated in Figure 1) still shows that not only are school participation rates lower among older children among the five to fifteen year old group, but in particular, teen-aged boys are more likely to be out of school than their girl counterparts.
Opportunity costs for keeping teen-aged boys in school are higher. Uniform education cash grants of 300 pesos per child beneficiary in Pantawid does not address the disparities in school participation, especially between older secondary age children (and younger ones), and between boys and girls.
This school year, the DSWD started to implement an Expanded CCT (ECCT) to allow child beneficiaries to complete their secondary school education, with P500 being provided to each ECCT high school beneficiary.
Differentiated grants that account for sex and age though may have to be implemented by DWSD if it were to address the clear difference in school participation between older versus younger aged children, and between boys and girls.
In addition, as the following Table shows, the proportion of secondary-aged children that are OOSC appear to be highest among the poor, and among very poorest regions (such as ARMM, and Bicol), which suggests that economic reasons still prevent children from exercising their right to basic education.
Table 2
Percentage of secondary school age children that are out-of-school, by age, sex and other characteristics
MALE FEMALE BOTH SEXES
OOSC rate No. of children OOSC rate No. of children OOSC rate No. of children
TOTAL 9.37 403,626 4.29 178,619 6.88 582,245
Age (in Years)
12 2.70 29,812 1.68 17,404 2.20 47,215
13 6.44 72,139 3.21 34,773 4.85 106,912
14 10.09 98,428 3.48 34,204 6.78 132,631
15 18.38 203,248 8.74 92,238 13.67 295,487
Per Capital Income Quintile
Poorest 15.03 168,157 7.74 80,206 11.52 248,362
Second 12.28 113,449 4.09 39,621 8.09 153,071
Middle 8.62 78,989 3.99 32,805 6.43 111,794
Fourth 3.36 24,305 2.62 19,118 2.99 43,423
Richest 3.01 18,726 1.14 6,868 2.09 25,595
Region
Region I - Ilocos Region 11.52 26,279 3.87 7,171 8.09 33,450
Region II - Cagayan Valley 9.09 13,272 2.33 3,096 5.87 16,368
Region III - Central Luzon 9.74 43,113 4.25 19,926 6.91 63,040
Region V- Bicol 12.17 34,008 6.56 18,447 9.36 52,454
Region VI - Western Visayas 7.28 25,464 0.95 3,218 4.16 28,682
Region VII - Central Visayas 12.14 37,036 2.73 7,481 7.69 44,517
Region VIII - Eastern Visayas 9.00 20,910 6.00 12,448 7.59 33,358
Region IX - Zamboanga Peninsula 9.46 16,071 4.49 7,408 7.01 23,479
Region X - Northern Mindanao 10.25 20,047 5.93 12,797 7.99 32,843
Region XI — Davao 9.04 18,116 2.44 3,822 6.15 21,938
Region XII - SOCCSKSARGEN 10.31 22,061 5.79 12,502 8.04 34,563
National Capital Region 5.50 25,475 1.24 5,851 3.34 31,326
Cordillera Administrative Region 17.59 12,535 3.84 2,709 10.75 15,245
Autonomous Region in Muslim Mindanao 15.41 30,986 15.02 28,343 15.22 59,329
Region XIII - Caraga 6.73 8,571 3.25 4,283 4.96 12,854
Region IVA - CALABARZON 7.30 38,407 4.18 21,446 5.76 59,853
Region IVB - MIMAROPA 7.36 11,275 5.53 7,669 6.49 18,945
OOSC among five to fifteen-year-old children remains a challenge, especially in ARMM, as security issues may also be preventing families from sending their kids to schools, thus giving another reason why government must exert more efforts in ensuring lasting peace, aside from working on a more inclusive development.
Table 3. Percentage of OOSC aged 5 to 15 to Tal Number of 5 to 15 Year-Old Children in 2013, by Sex and by Region
Source: Authors' calculations from APIS 2013, PSA
Reassess uniform grants
REGION MALE FEMALE BOTH SEXES
Region I - Ilocos Region 6.63 4.39 5.56
Region II - Cagayan Valley 5.81 2.26 4.12
Region III - Central Luzon 6.79 4.27 5.56
Region V- Bicol 5.66 4.84 5.27
Region VI - Western Visayas 4.20 0.65 2.47
Region VII - Central Visayas 6.92 2.68 4.87
Region VIII - Eastern Visayas 5.76 3.80 4.81
Region IX - Zamboanga Peninsula 7.21 4.06 5.66
Region X - Northern Mindanao 6.28 3.69 5.01
Region XI — Davao 5.65 2.91 4.33
Region XII — SOCCSKSARGEN 9.00 5.79 7.42
National Capital Region 4.80 2.43 3.64
Cordillera Administrative Region 10.65 4.63 7.72
Autonomous Region in Muslim Mindanao 17.09 16.35 16.73
Region XIII — Caraga 4.85 3.48 4.18
Region IVA — CALABARZON 4.96 1.94 3.50
Region IVB — MIMAROPA 5.27 5.80 5.53
TOTAL 6.44 3.90 5.21
In conclusion, recent data from 2013 (in comparison with data from 2007 and 2010) sourced from results of the APIS show that government’s investments in basic education are working.
It will be important though to re-assess the uniform grants given in Pantawid, although the current cash incentive for high school beneficiaries is much higher (500 pesos) than for pre-primary and primary school beneficiaries (300 pesos). Provision for higher than usual Pantawid cash incentives should be similarly provided, for boys to address the disparities between older boy children whose opportunity costs for going to school and staying in school are higher.
A graduation gift may be an extra incentive to complete schooling. In Mexico’s CCT, additional cash provisions for females were provided a decade ago, when girls were at a disadvantage in school participation, and for children nearing the last stage of the education cycle, which led to a considerable bridging of the gender divide in Mexico, and improvements in school completion.
The extension of support to high school beneficiaries in Pantawid is welcome but further deepening of the impact of the CCT could result by increasing support for older children to encourage school completion, and for boys to address gender disparities in school outcomes currently in favor of girls.
In isolation, Pantawid will not be enough to reduce poverty in the short term, but they help to incentivize the poor to make investments in their human capital.
Current investments in the social sector need to be sustained and deepened so government can help ensure that no one, whether poor or non-poor, male or female, is left behind in education attainments as the country pursues a path of growth, prosperity and development. — Rappler.com
Money in basic education, cash transfers: What works?