Last April 10, the Philippine Statistics Authority (PSA) released estimates of poverty incidence in the first semester of 2018 (see Table 1), stating that the proportion of Filipinos in poverty is 21.0%, a reduction of 6.6 percentage points compared to the same period 3 years ago (then recorded at 27.6%).
Further, the proportion in extreme poverty – i.e., those coming from families with incomes less than what is required to meet basic food needs – was estimated at 8.5% in the first semester of 2018. This is also lower by 4.5 percentage points from the first semester of 2015 (then estimated at 13.0%).
Several netizens and people from civil society started criticizing these figures not because of the storyline on the reduction of poverty, but as regards the benchmark figures called poverty lines (that are used to count the poor and), which were around P10,000 per month for a family of 5, according to the PSA.
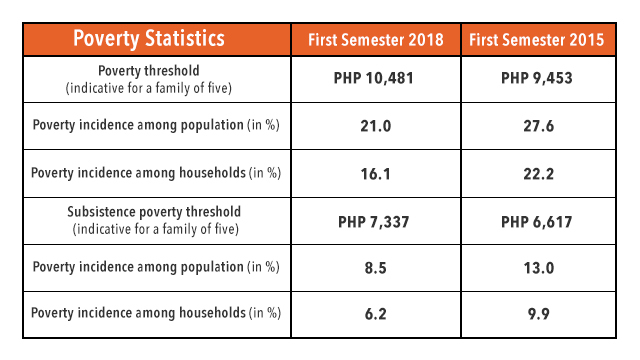
Table 1: Selected Official Poverty Statistics for the First Semesters of 2018 and 2015. Source: PSA
Some people in the media started asking reactions from the presidential spokesman, who pointed out that the PSA must have studied how to come up with poverty lines before it released its report on official poverty in the country. In this article, I clarify some points that caused confusion, and reactions against the official poverty lines.
What's a poverty line?
Before I answer this question, it is important to first understand that there are 3 steps to counting the poor (see Figure 1 below):
Defining a welfare indicator. In the Philippines, the PSA uses income per capita, while national statistics offices (NSOs) of many developing countries use measures based on consumption expenditure rather than income.
Setting a poverty line. Most developing countries, including the Philippines, make use of the basic needs approach (though the details for implementing this varies a bit across countries).
Summarizing the poverty data. The PSA typically releases poverty incidence estimates – i.e., the proportion of people (or households) with income per capita below the poverty threshold; as well as the subsistence incidence – i.e., those whose incomes per capita do not even reach the food component of the poverty line (also known as subsistence incidence) as a measure of extreme poverty.
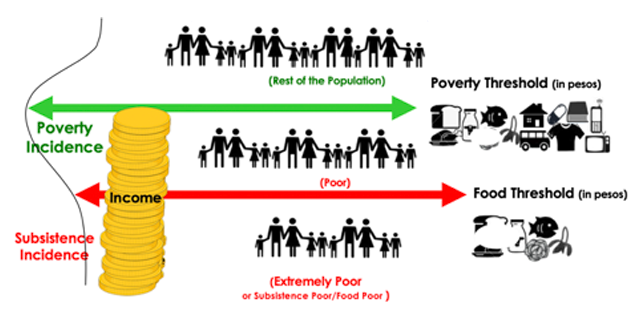
Figure 1: How the PSA estimates poverty
Per capita income is the total household income divided by the family size. Total income is obtained by adding up incomes from all sources, including employment, social transfers, home production, informal support, income from rent, and the like.
Aggregated consumption/expenditure, meanwhile, consists of adding up expenditures of all items purchased from market sources and items obtained from other sources (such as gifts and home-produced items that are consumed by the household) using imputed values at local market prices.
Data on income and consumption are sourced from household surveys (and not censuses), which are designed to be representative of the household population in a country. In the Philippines, the PSA has traditionally designed the triennial Family Income and Expenditure Survey to be representative at the regions, though PSA has recently re-designed the FIES to generate reliable estimates at the provincial level.
But is income or expenditure a better welfare indicator? That deserves a whole discussion altogether. Some issues regarding this and other related matters have been discussed in a policy note I wrote more than a decade ago for the Philippine Institute for Development Studies.
Let me turn now to discussing how the PSA determines the official poverty line. For poverty measurement, NSOs such as the PSA define a poverty line to be the value of the welfare indicator (in our case, per capita income) deemed necessary to maintain a minimal standard of well-being.
For monetary indicators based on income or expenditure, the poverty line represents what is required to purchase a bundle of basic goods (typically food and nonfood items).
For nonmonetary indicators, like the years of schooling of an adult aged 15 and over, the United Nations Education Scientific (Unesco) in a 2010 Education for All Report recommends using 4 years as the education poverty line – pointing out that those in the labor force with less than 4 years of schooling are unlikely to have basic literacy and numerical skills required for stable occupations (and two years of schooling as an extreme poverty line since, when adults 15 and over have less than 2 years of education, they are at an even worse disadvantage in having opportunities for advancement).
In developing countries that use income or expenditure data for counting the poor, the poverty lines are said to be “absolute” poverty lines based on a fixed welfare standard that is merely updated across time by price changes, and whose differing nominal values across subnational areas merely reflect cost of living differences.
The Philippines and other developing countries use the cost-of-basic needs (CBN) approach for setting the poverty line. This involves the use of a food consumption bundle, anchored on calorie requirements, as an artifice to determining the cost of the minimum food nutritional (calorie) requirements.
In the Philippines, we use 2,000 calories per person per day, although this is generous as, according to the food consumption survey of the Food and Nutrition Research Institute (FNRI), even the wealthy do not eat as much per day. A nonfood allowance based on the nonfood budget shares of poor households is also typically added to this food cost to obtain the poverty line.
The Philippines differs in its implementation of the CBN approach by its adoption and use of “low-cost” menus for rural and urban areas in each province as the artifice for estimating the food component of the poverty line. (Thus, the P7,000 monthly for a family of 5 for 2018 is really an average in the entire country.)
Basket of items
All other countries that adopt the CBN approach use a basket of items instead.
The one-day food menus in the Philippines are valued with provincial prices to come up with provincial urban/rural food poverty lines. These menus meet the 100% Recommended Dietary Allowance (RDA) adequacies not only for energy but also for protein and even provide for 80% RDA adequacies for other nutrients and vitamins. The FNRI prepared these low-cost menus, which were validated through consultations. The menus take into account the availability of food commodities that are cheap and nutritious.
Some costly food items, such as milk and pork liver, are also included in the menu when these food items are the only sources of the nutrient requirements, say, for iron adequacy. The menus are attractive to the extent that they can be formulated to satisfy other nutrient requirements besides calories.
Further, the menus started off with a national menu in mind, to ensure that menus are comparable across the country.
In many developing countries, the Philippines included, the non-food requirements are estimated indirectly using Engel’s coefficient – i.e., the food share of those near the poverty line. In the Philippines, since those at the bottom of income distribution spend around 70% for food, thus, the inverse of this food share – i.e., 1/0.7=1.43 – is used by PSA to add non-food adjustments.
In a few countries, such as Malaysia, the non-food component of the poverty line is even calculated with an actual non-food bundle. The typical practice though is to use an indirect estimation approach.
Survival line
For quite a while, countries have adopted a viewpoint that puts huge emphasis on the income (or expenditure) perspective. Poverty is viewed as income-deficiency – i.e. the deprivation of financial resources – and, thus, poverty reduction is about income boosting.
The reactions of many to the roughly P10,000-a-month poverty line for a family of 5 in 2018 is largely a recognition that they cannot “survive” with that amount. Some have even challenged PSA officials and staff to “survive” with that amount. Some may have been reminded of the P10,000-a month figure that an official of the National Economic and Development Authority reportedly mentioned about a “decent” quality of life, although the NEDA figure was a mere artifice for explaining inflation and not a decent life.
While opinions are opinions, and everyone is entitled to have one, it is IMHO important for people to have dispassionate arguments and a better understanding of issues, especially very technical ones such as poverty diagnostics.
Let us firstly recognize that the term survival means different things to different people. An ultra-rich Filipino will not “survive” with P1 million per month. The PSA, like many NSOs, struggle with helping us answer a fundamental question: has poverty increased, decreased, or stayed the same?
While NSOs such as the PSA have not fully agreed on a fully comparable methodology for counting the poor, the approaches however are surprisingly similar, according to several handbooks on poverty measurement by the World Bank and by the United Nations Statistics Division.
They are not based on what is needed to survive, but rather on estimating the cost of “basic needs,” and here is where further confusion may result. But what exactly do we mean by basic? Would cellphone usage or recreation be basic? And how should we be costing these “basic needs”?
Some familiar with the food menus argue why is the PSA using least-cost prices? Why is the cost of the food component per person per day even lower than the daily food-budget costs of prison inmates? Unfortunately, what is adding to our confusion is that our daily costs are not matching these poverty thresholds on a per person per day basis.
But what we have to acknowledge is that average Filipinos – i.e., middle income Filipinos, and even more so upper-income Filipinos – have a different consumption basket than those at the lower part of income distribution, and the unit prices used by the middle- and upper-income are much higher than those of the lower-income.
People thus were equating their consumptions (and prices) with those of the poor.
Global monitoring
Global monitoring of poverty is undertaken by the World Bank using another “absolute” poverty line that used to be $1 per person per day in 1991 purchasing power parity (PPP) indices.
The one-dollar-per-person-per-day has subsequently been updated to US$1.25 per day in 2005 PPP prices, and recently into $1.9 per day in 2011 PPP prices, particularly to monitor the Sustainable Development Goals, making use of newer price data from the International Comparison Program.
The PSA’s poverty line, just like national poverty lines of other countries, is not tied to the international poverty line, though if we were to convert the national poverty line, it would come down to a much higher figure.
This is why the official estimates of the Philippines for income poverty are higher than the World Bank estimates of poverty for the Philippines, though the trends in the poverty incidence figures are generally the same.
What can we learn about poverty (and inequality) in PH?
Whether we think that the official poverty lines are unrealistic and do not make sense, what we should ultimately get bothered with is that 1 out of every 5 Filipinos (21.0%) are from families with incomes below P10,000 a month (if the family is a family of 5), and that one in 10 (8.5%) have incomes 30% less than this threshold (around P7,000 a month).
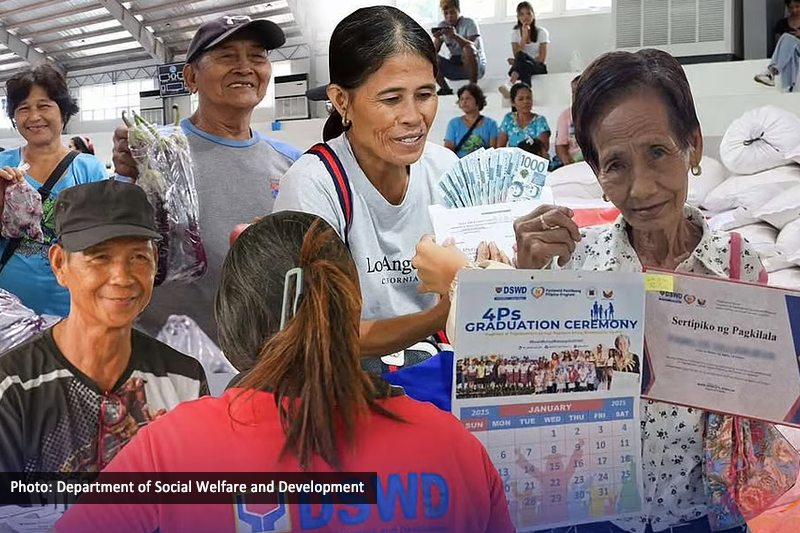
We should not be surprised that poverty (including extreme poverty) has reduced in the first semester of 2018 compared to the same period in 2015, especially as the government has continued the past government’s support for the Conditional Cash Transfer for poor families, for the Social Pension program for indigent elderly, and even provided assistance for the poorest 10 million families that got affected by the tax reform law.
Although the PSA has been at the forefront of best practices in statistical measurements globally, the PSA should make best efforts to ensure that trust in data and statistics continue as credibility is the bedrock of official statistics.
The data landscape is now changing rapidly, and the PSA has to be more innovative, explaining its methods with infographics and videos, to the public. The PSA needs more effective communication strategies for its releases, given that people, especially netizens, are providing their feedback about the usefulness of official statistics. Years ago, it was decided to release poverty statistics from the FIES as there were plans to have the Annual Poverty Indicator Survey (APIS) collect more questions on income, and consequently generate estimates of poverty annually. However, poverty data from APIS and FIES are fundamentally different.
Since the PSA has some plans to remove income data from the APIS so that APIS focuses more on non-monetary poverty correlates, and the release of the first semester FIES-based poverty data comes too close to elections, it may be best to re-examine release dates on poverty data, as well as study whether the consumption bundles of the poor are changing (and thus require changing approaches to food poverty line estimation and non-food adjustments). It may help to reconvene a Technical Committee on Poverty Statistics (which was how it used to be) rather than the current Inter-Agency Committee set-up, especially as poverty measurement has a lot of technical concerns.
What government and everyone in this country should ultimately recognize is that we should all work toward ensuring the poor are at the center of policy attention as we move along our economic growth path. We ought to work extra hard to make the poor and those low-income but not poor (earning between the poverty threshold and twice the poverty threshold) move up to middle-class status.
A recent study on the middle class that I worked on with Angelo Santos and Jana Flor Vizmanos involved simulations on the 2015 FIES data. The results show that if real incomes per capita for all low-income households grow at a constant annual rate of 2.4% (i.e., the average income growth of the bottom 40% between 2012 and____), the low-income-but-not-poor cluster can transition to middle income by 2023, but the poor, on average, can only do so by 2051. For the poor to transition to incomes of twice the poverty line (or beyond) by 2040, their per capita incomes should grow annually by 3.4% in real terms, or 42% more than the benchmark 2.4%.
Figure 2: Number of years for the low-income class to transition into lower middle income

While the poor should be the main targets of social protection, they are not the only ones vulnerable to future poverty. Households slightly above the poverty line especially face similar risks given the dynamics in poverty conditions that can result from shocks to income from health or death of the main income-earner in a household, a job loss, or business failures from natural disasters.
There is also imminent risk that whatever inequalities we currently have may just widen with the emerging Fourth Industrial Revolution or FIRe that is changing business practices and the labor market.
Let us not focus on the trees and not see the forest. We have to get our act together and have a whole-of-nation approach to ensure that no person, man or woman, young or aged, disabled or not, will be in poverty by 2030 or even 2040, and preferably even sooner. – Rappler.com

